Importing data
Adding data to a project
Data are added to a project by choosing Add Data in the PROJECT menu.
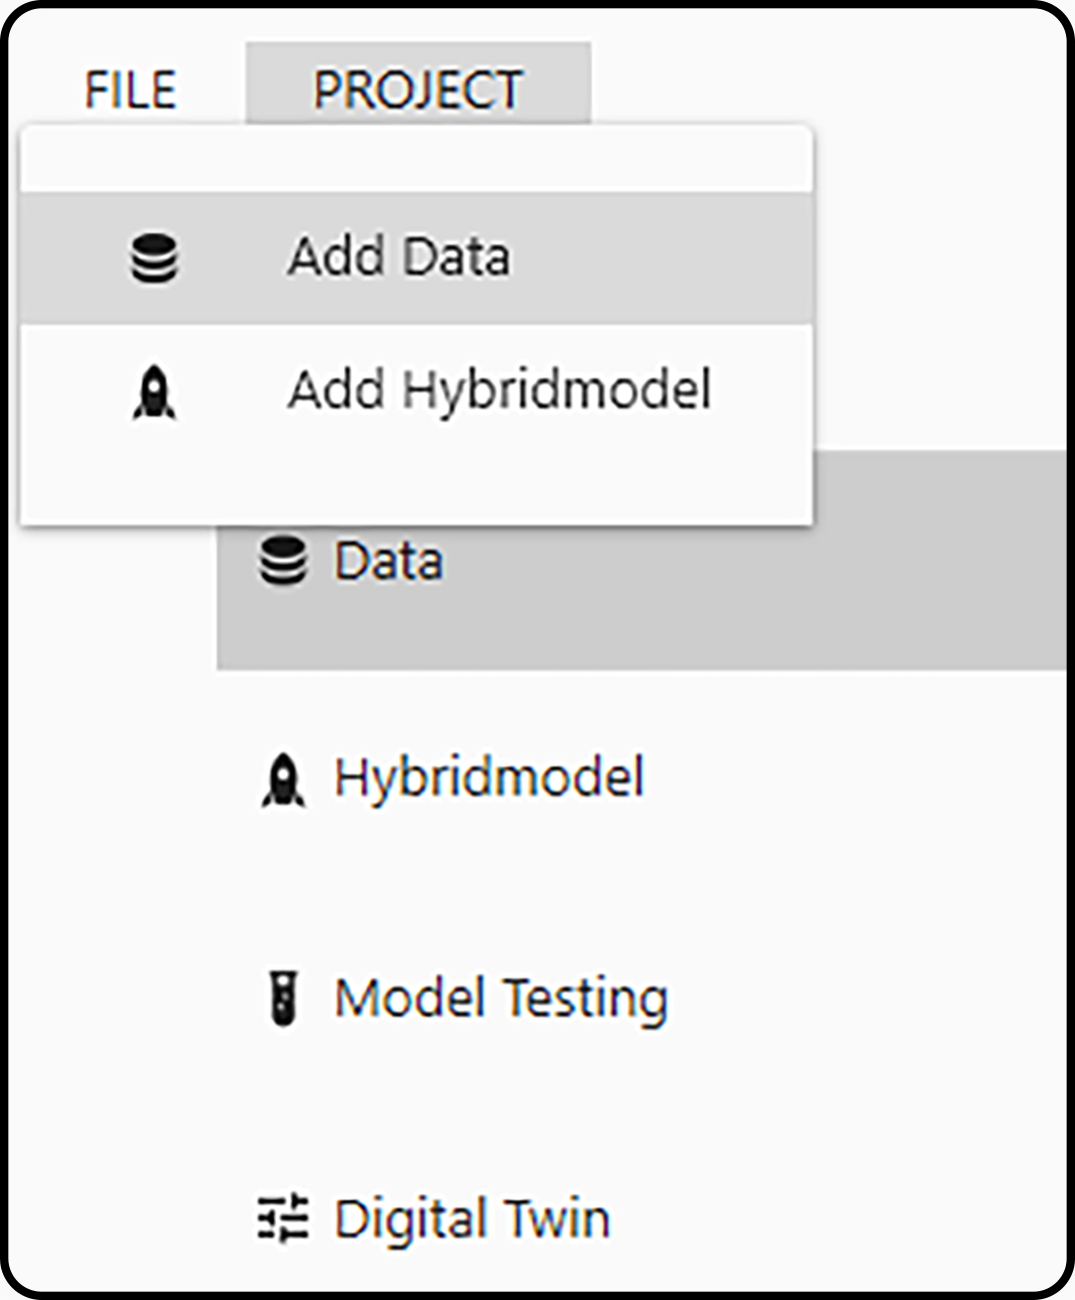
Figure 6. Adding data to a (possibly empty) project.
Caution
Data will be imported into the current selected project. In case you have multiple projects coexisting in the same Toolbox instance make sure, the one you want to import data to is properly selected.
In a next step a dialog opens asking the user to select the file format (file extension) and the file itself to be imported.
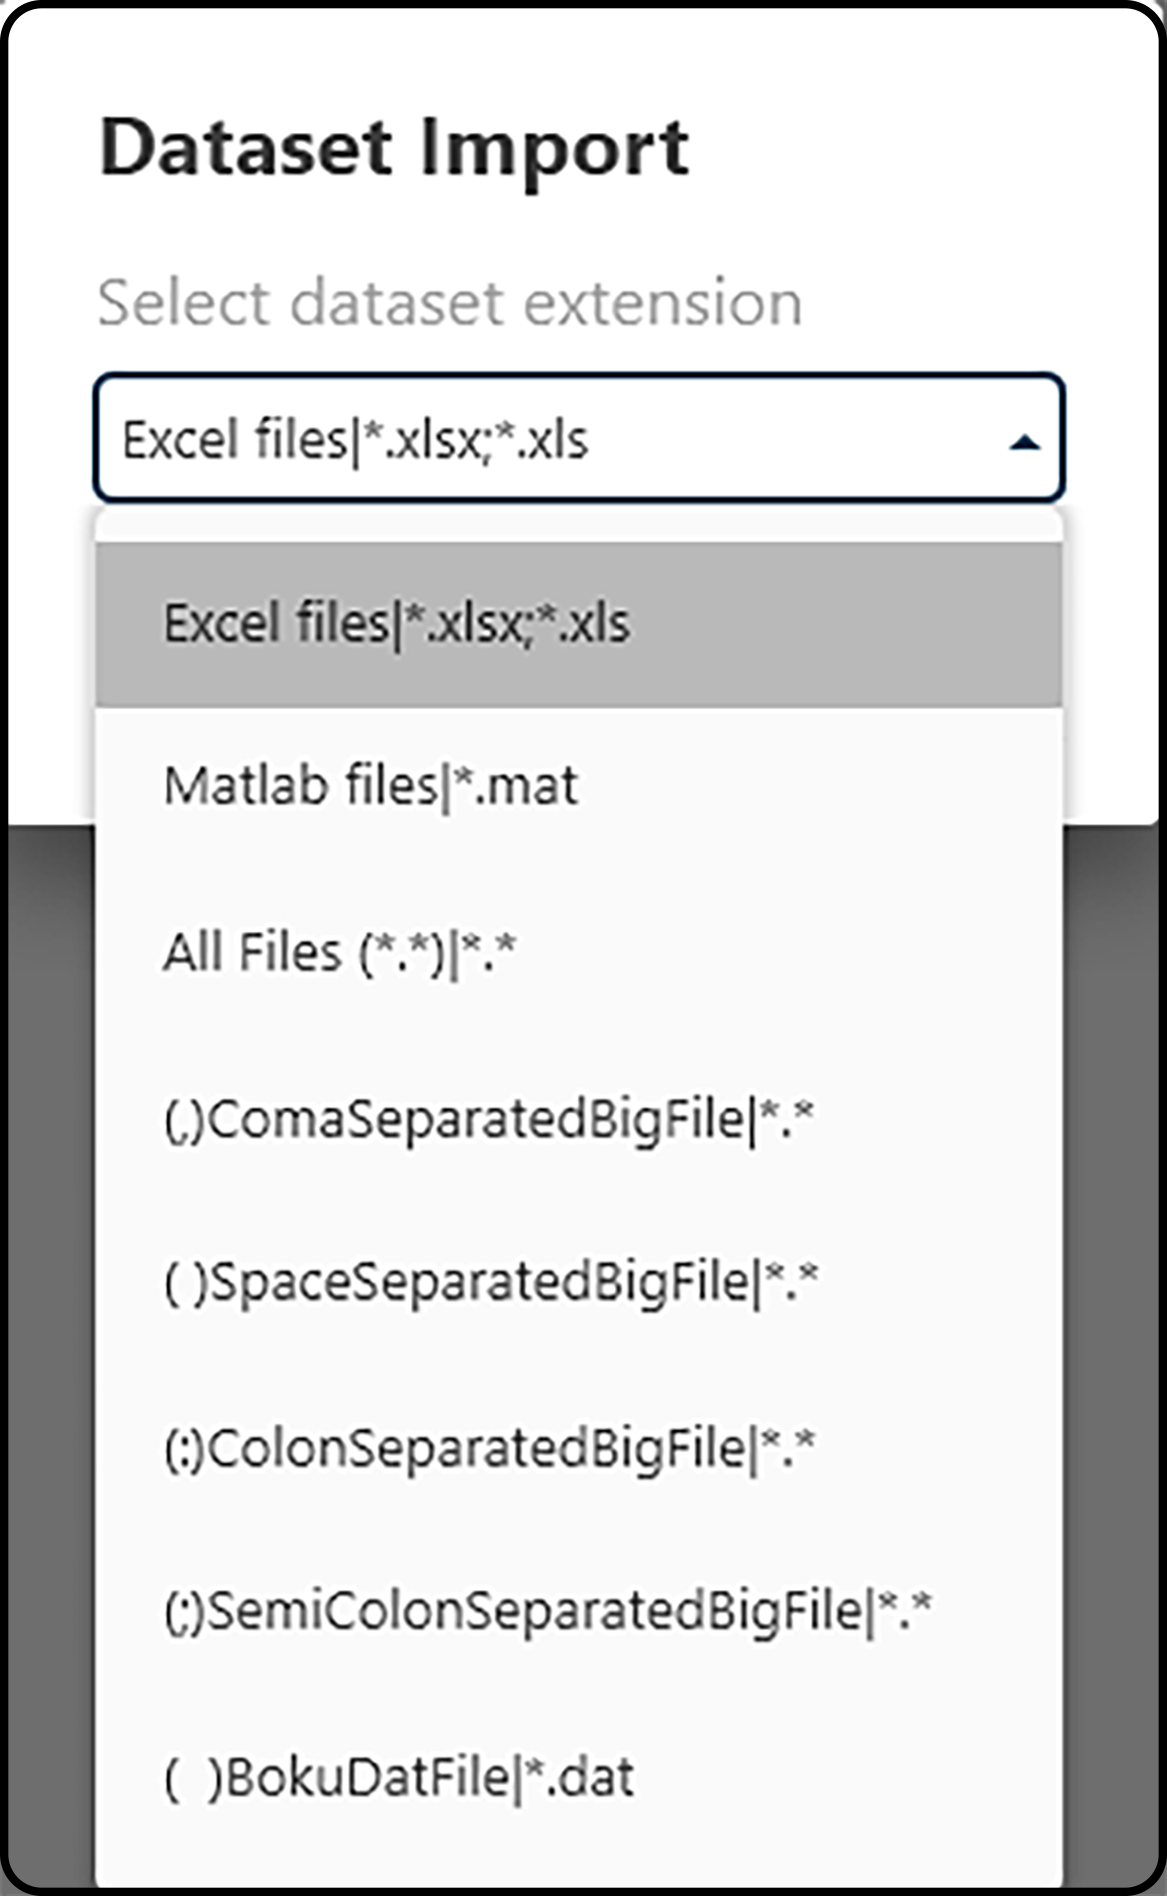
Figure 7. Selecting a file format.
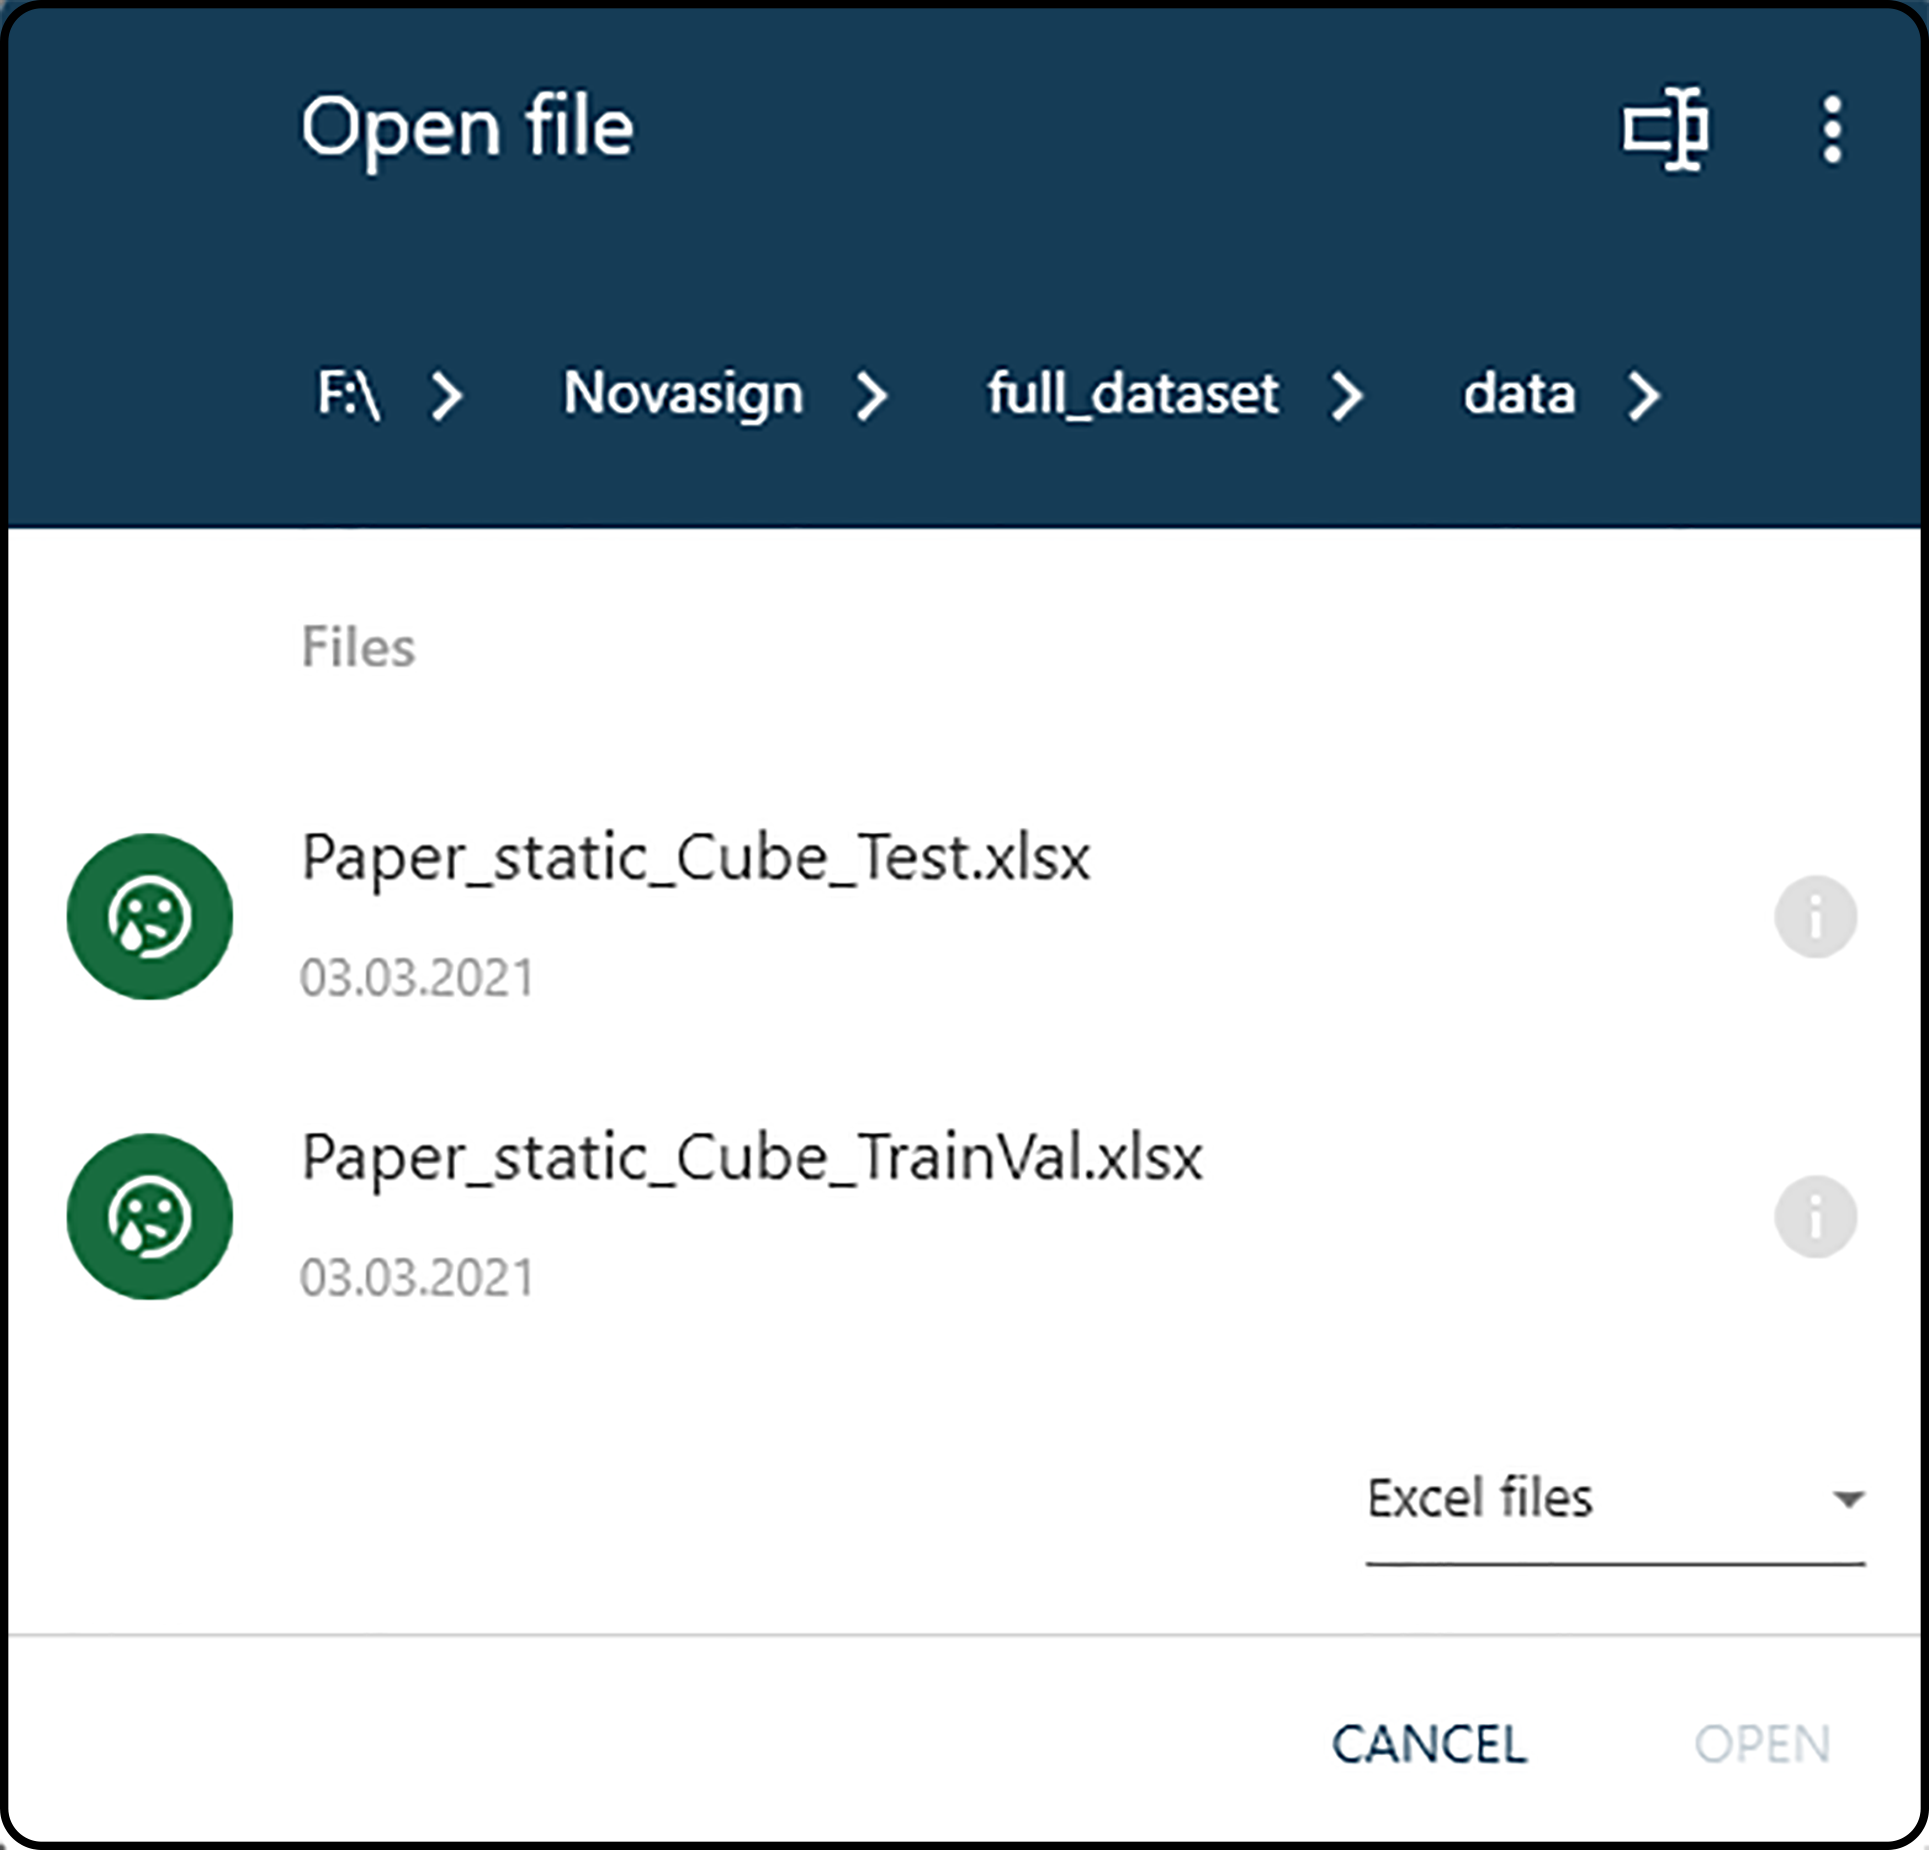
Figure 8. Selecting a file to import in the open-file dialog.
Note
The three vertical dots in the right upper corner of the open file dialog box can be used to change the drive.
Note
Only files of the previously chosen file format are shown in the following open file dialog.
Finally, in the import options dialog several details must be specified for the data set:
Name: name of the dataset within the Toolbox. By default the name of the imported file is taken. Long names may be truncated, but can always be changed manually.
Decimal Separator: is a comma
,or a dot.used as decimal separator in the source file?Sheets (only for the Microsoft Excel data format): which tab/sheet contains the data to be imported. It is possible to import multiple sheets at once.
Headers row: the row number containing the column headers. If the data set does not contain a header, set this value to
0.Columns: allows to select, which variables (columns) of the data set shall be imported. By default, all columns will be imported.
Range: the row numbers (in from - to format) of the data set to import. By default, all rows following the header-row (if available) are imported.
Series names: the column containing information on the run or experiment number.
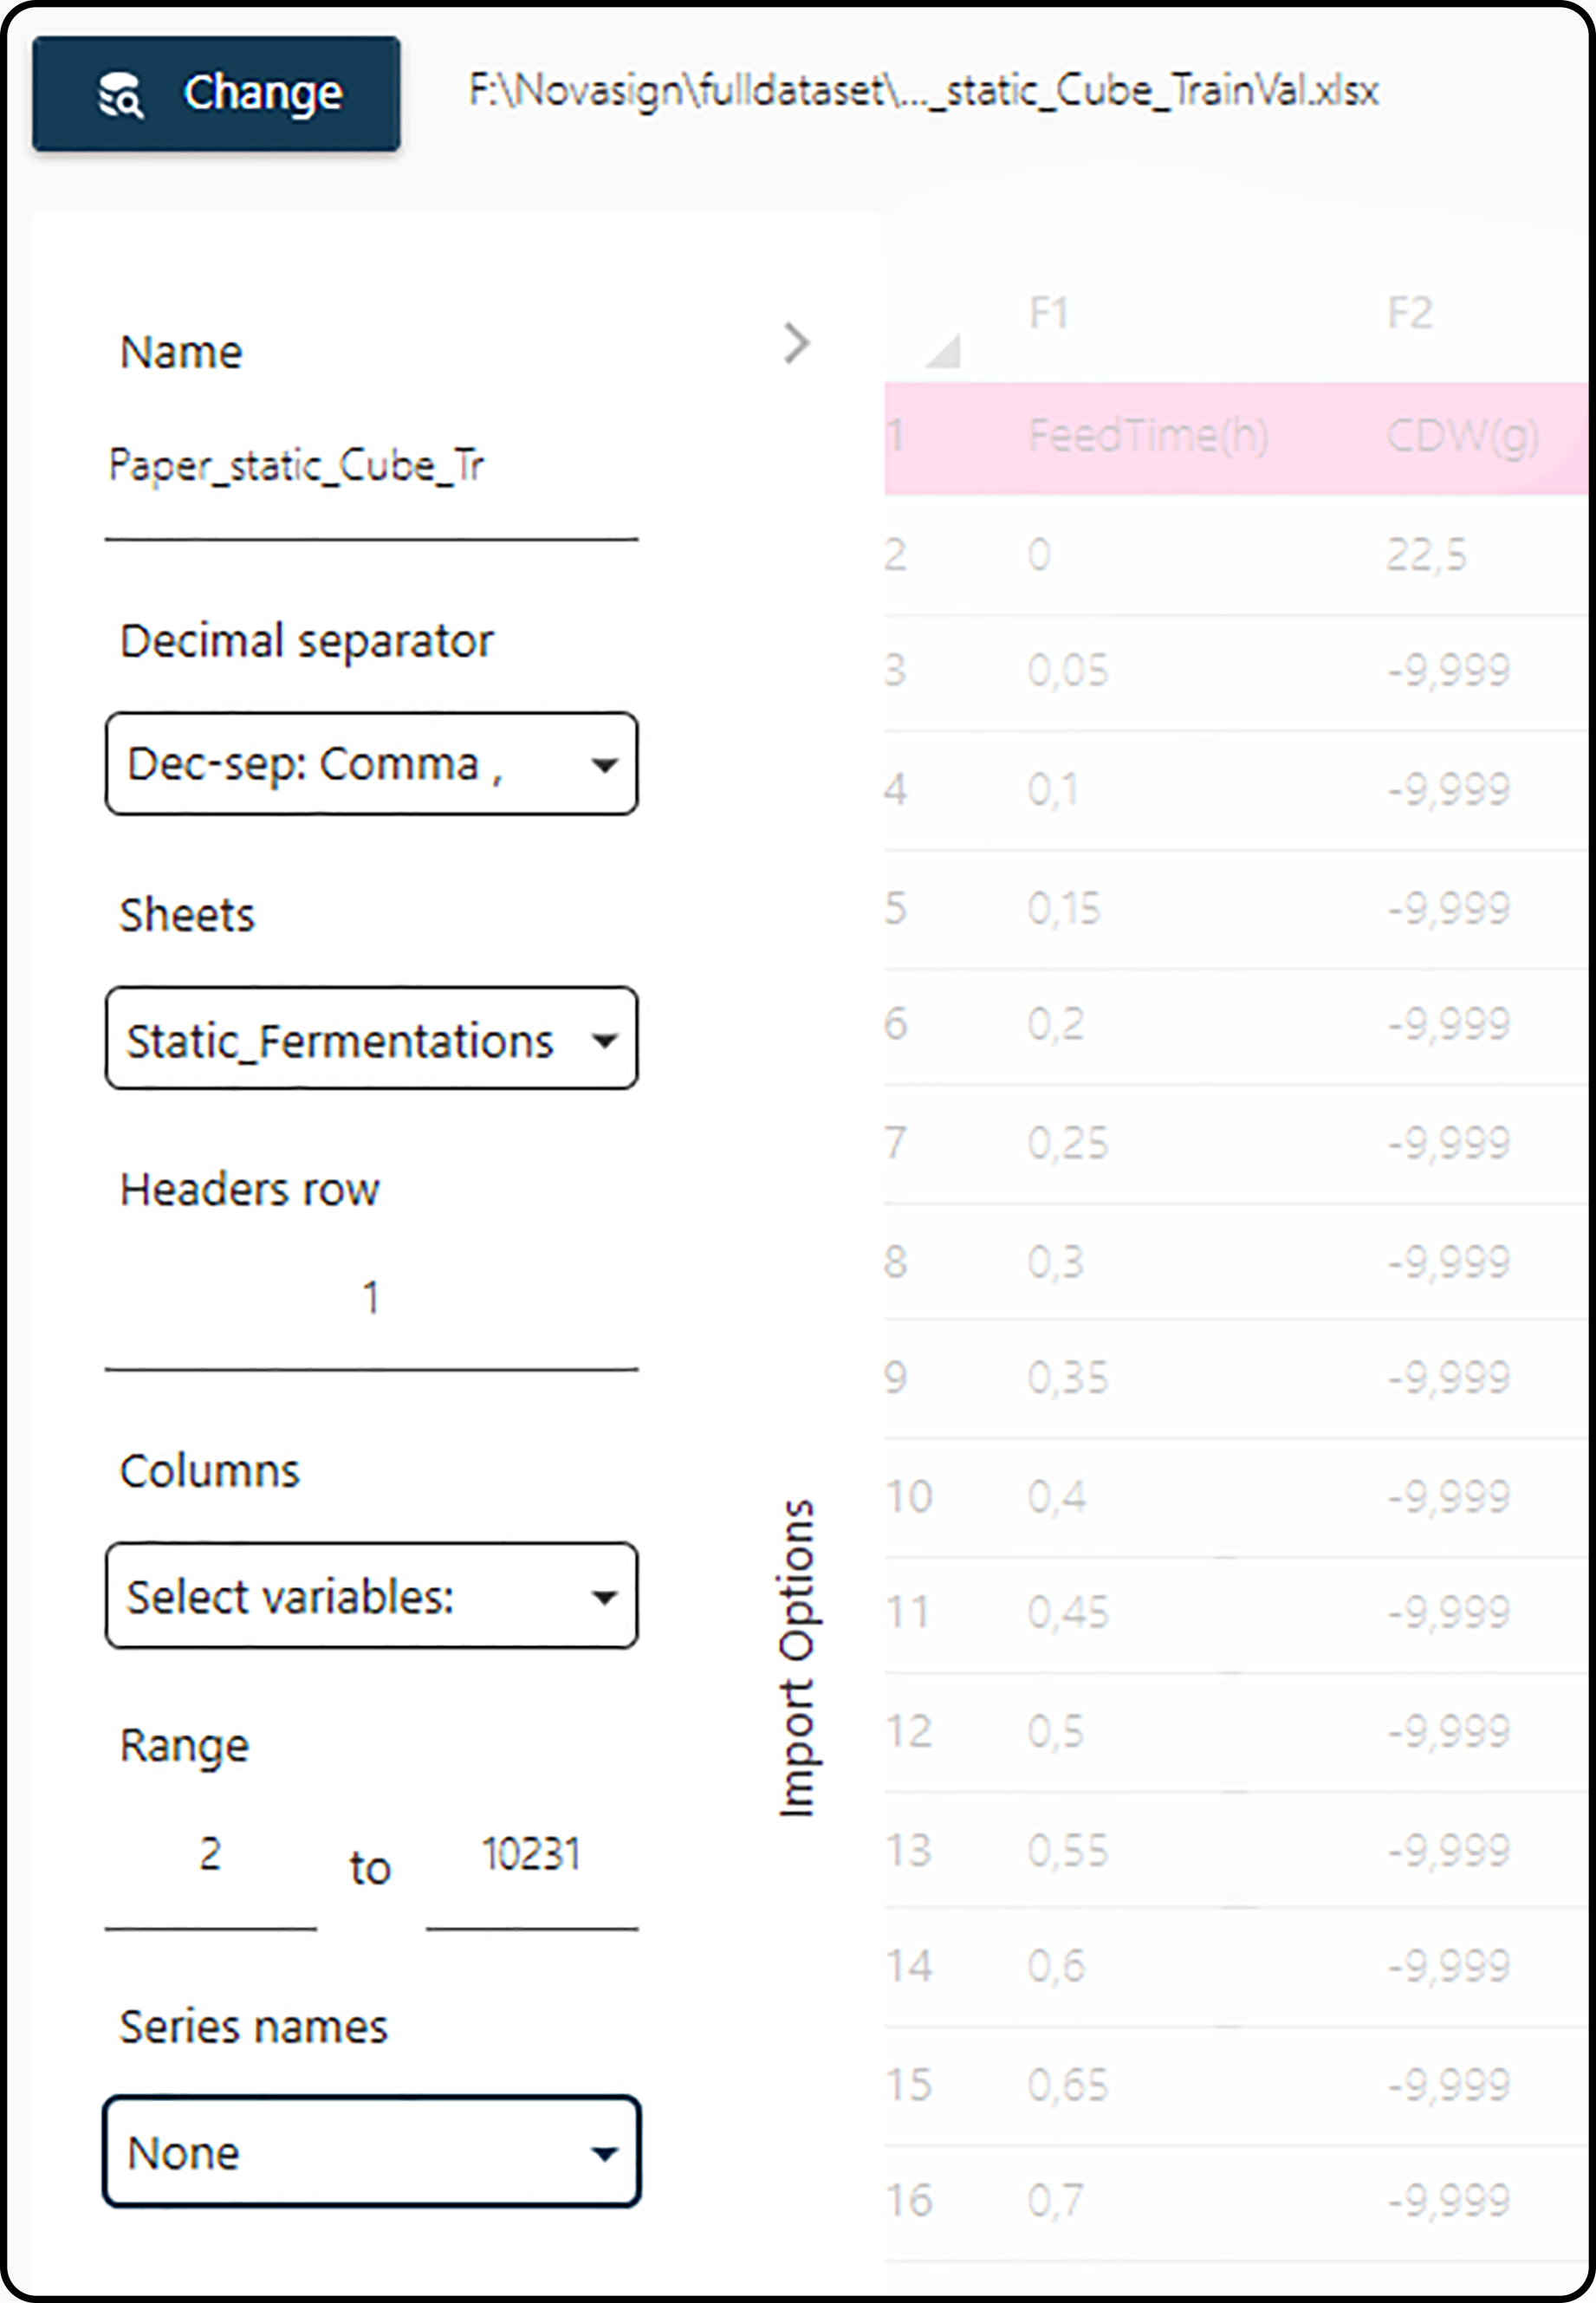
Figure 9. In the import options dialog details for the data set to be imported must be given.
In order to return to the previous step (file type selection), the button

in the left upper corner of the import options window can be used, but it is recommended to cancel the data import process and start from the beginning.
After a proper selection of the dataset details, the file is loaded. During the loading process, Loading data is displayed – please be patient, depending on the file size this process may take a while.
Note
If the data of interest are spread over multiple files, the import procedure has to be repeated for each of these files.
Details on import options
Headers, data format and missing values
It is recommended (but not mandatory) that data chosen for import have a header, i.e. contain the variable (column) names in the first row.
For datasets without headers, headers will be generated automatically during the import as
F+iwithibeing an auto-incremented integer starting with value 1. One header is created for each column:F1,F2, …For datasets with headers, the row containing the header must be specified in the headers row field in the import options dialog.
Note
If the file being imported is of type Microsoft Excel, multiple rows of headers in the file are allowed; nevertheless, only one will be selectable in the import options.
Note
All values in the data set must be numeric (exception: the header row(s), which typically contain(s) names/characters) and with a proper decimal separator for non integer values. Categorical (nominal or ordered) data must be transformed to (a series of) binary (0/1) variables prior to data import. Note that also the Series name column must contain numeric data only.
Note
Missing values are allowed in the data. It is recommended to either use blank or empty cells in the original data or
a dummy numerical value (such as -9.999). In the first case, the empty cells are automatically transformed to NaN during import,
in the latter case the dummy value is preserved during import, but can (and should) be corrected in a later stage.
Supported file types
The hybrid modeling Toolbox supports various file types.
Note
It is highly recommended to use the Microsoft Excel type (.xls or .xlsx) with one sheet/tab of data whenever possible.
The following table shows potential compatibility issues during import: for a certain source file type, extension/delimiter, presence/absence of a header and choice of import filter (in the dataset import dialog), information on potential import problems is given in the annotations.
File Type |
Extension or delimiter |
Header |
Filter criteria |
|||||||
Excel |
All Files |
MATLAB |
SeparatedBigFile |
BOKU |
||||||
Coma |
Colon |
Semicolon |
Space |
|||||||
Excel |
.xlsx, .xls |
No |
✓ [1] |
✓ [1] |
||||||
Yes |
✓ [1] |
✓ [1] |
||||||||
MATLAB |
.mat |
— |
✓ [7] |
|||||||
Any (delimited value) |
Comma |
No |
✓ [3] |
|||||||
Yes |
||||||||||
Colon |
No |
✓ [3] |
||||||||
Yes |
||||||||||
Semicolon |
No |
✓ [3] |
||||||||
Yes |
||||||||||
Space |
No |
✓ [3] |
||||||||
Yes |
||||||||||
BOKU |
.dat |
— |
✓ [6] |
|||||||
Annotations
Warning
Matlab: As indicated in the annotations above, .mat files are supported if they contain numeric only matrices. Existing matrices will be
loaded as tables. If more than one matrix exists, the behavior will be the same as importing a Microsoft Excel file with multiple sheets
(see Sheet selection).
A valid .mat file example:
Create a
.matfile in MATLAB. Execute,A = rand(8); B = rand(5); C = rand(7); save('CoolMatlab.mat', 'A', 'B', 'C');
and 3 (random) matrices will be created and saved as
CoolMatlab.mat.Import the generated file
CoolMatlab.matinto the Toolbox by selecting the Matlab Files extension filter.
The import options window will pop up with the dataset name CoolMatlab and 3 available sheets (A, B, C).
Decimal separator
It is highly important to select the correct decimal separator for the source file in the drop-down menu – either a comma , or a dot .
Note
Selection of the decimal separator is not available in the import options, if the chosen file type is SpaceSeparatedBigFile, CommaSeparatedBigFile or SemicolonSeparatedBigFile. Instead, it’s predefined according to the system configuration. This behavior will be modified in future versions for a higher flexibility.
Danger
If the dataset being imported uses a dot/period . as decimal separator and Dec-sep: Comma , is (wrongly) selected, the imported values will differ from the original ones and no error will be prompted.
Example
\({\color{Red} ✘} \; Original: 0.05 \rightarrow Imported: 5\)
\({\color{Red} ✘} \; Original: 27.49 \rightarrow Imported: 2749\)
\({\color{Green} ✓} \; Original: 2.0 \rightarrow Imported: 2\)
Data viewer
Besides setting several options, the import options dialog also displays the data on the right-hand side of the window. Clicking in one of the cells allows for changing/manipulating these values. It is recommended that larger changes to the data are performed in an external application (e.g. Microsoft Excel).
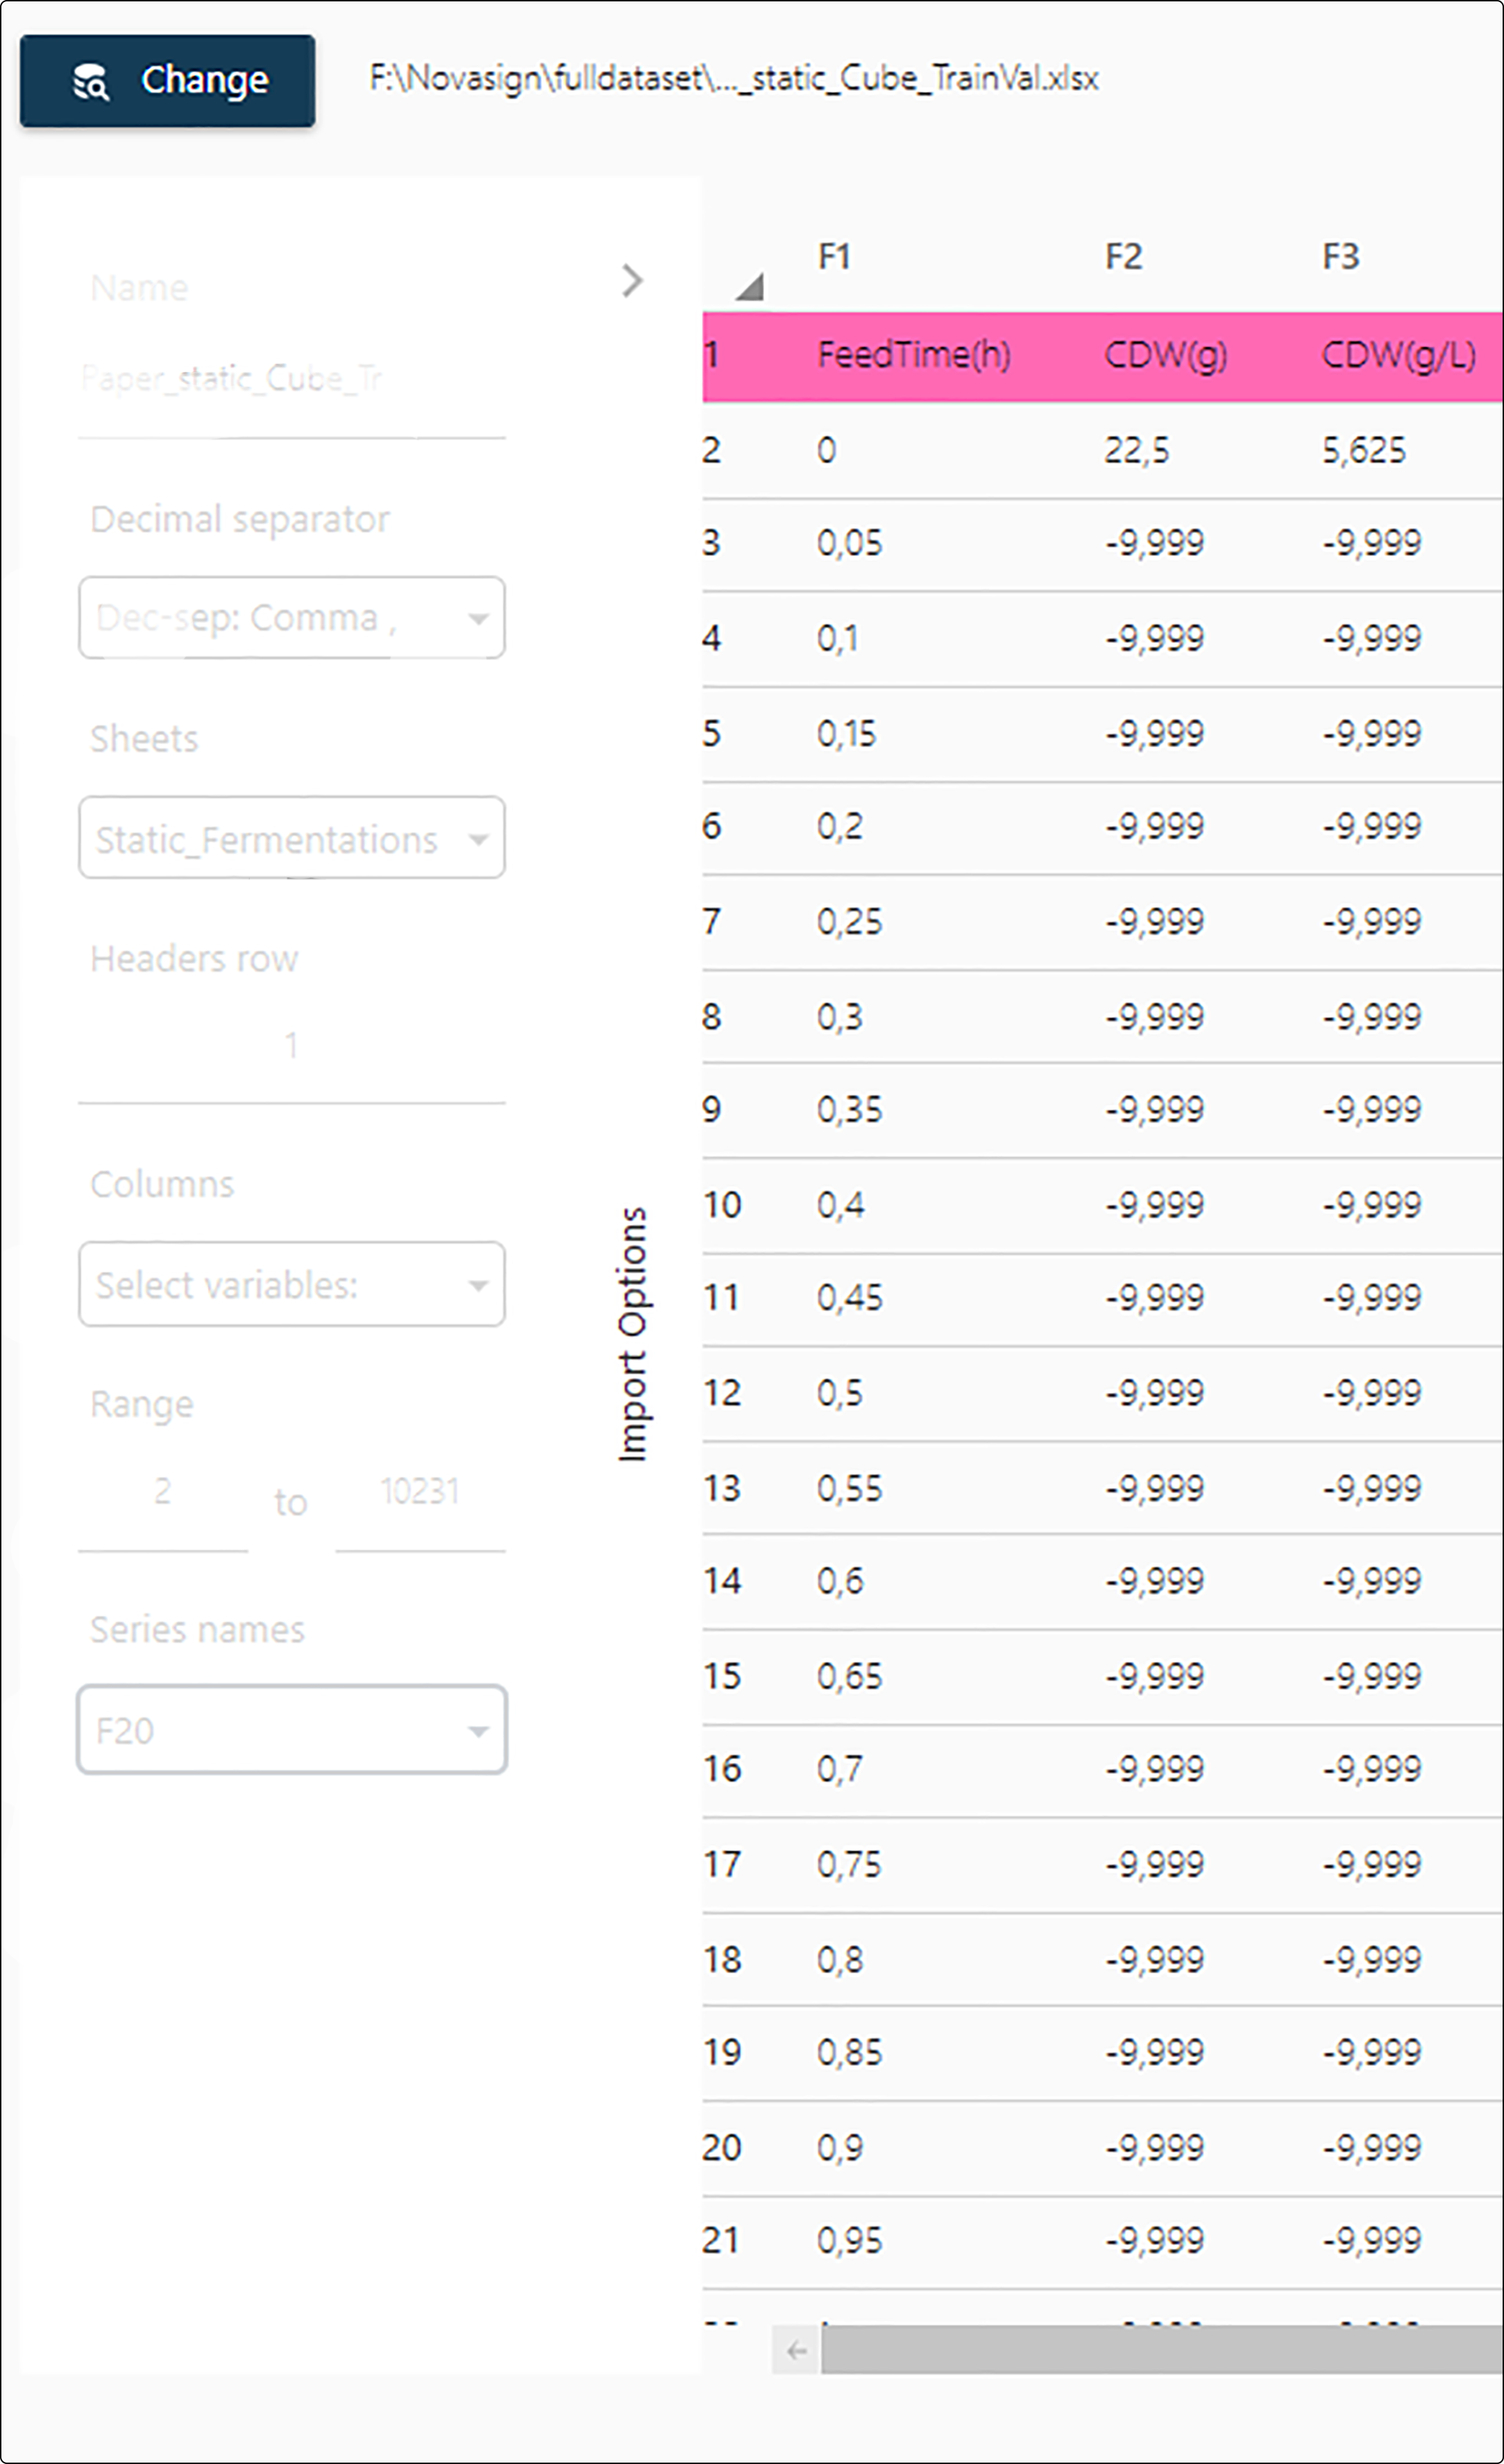
Figure 10. The data viewer in the import options dialog allows for data manpulation.
Sheet selection
The Sheets drop-down menu in the import options dialog allows for selecting one or more data sheets to import. In case there is more than one sheet in the source file,
by default the first sheet is preselected.
for each selected sheet a separate data set will be generated/imported. The name of the data sets follow the scheme File name_sheet name.
If no sheet is selected, nothing will be imported and the effect is the same as clicking on Cancel.
Attention
If multiple sheets are checked, import details, such as the headers row, the column- and row-range to import as well as the selection of the series name must be set individually for each sheet. To do so, select each sheet and the previous fields will be updated to its correspondent individual setup.
Note
Selecting a sheet for data import is accomplished via the corresponding check-boxes in the Sheets drop-down menu. To display different sheets in the data viewer (in order to decide on the values for the import parameters), the sheets have to be selected by clicking in the red marked area besides the check-boxes, as shown in the next figure.
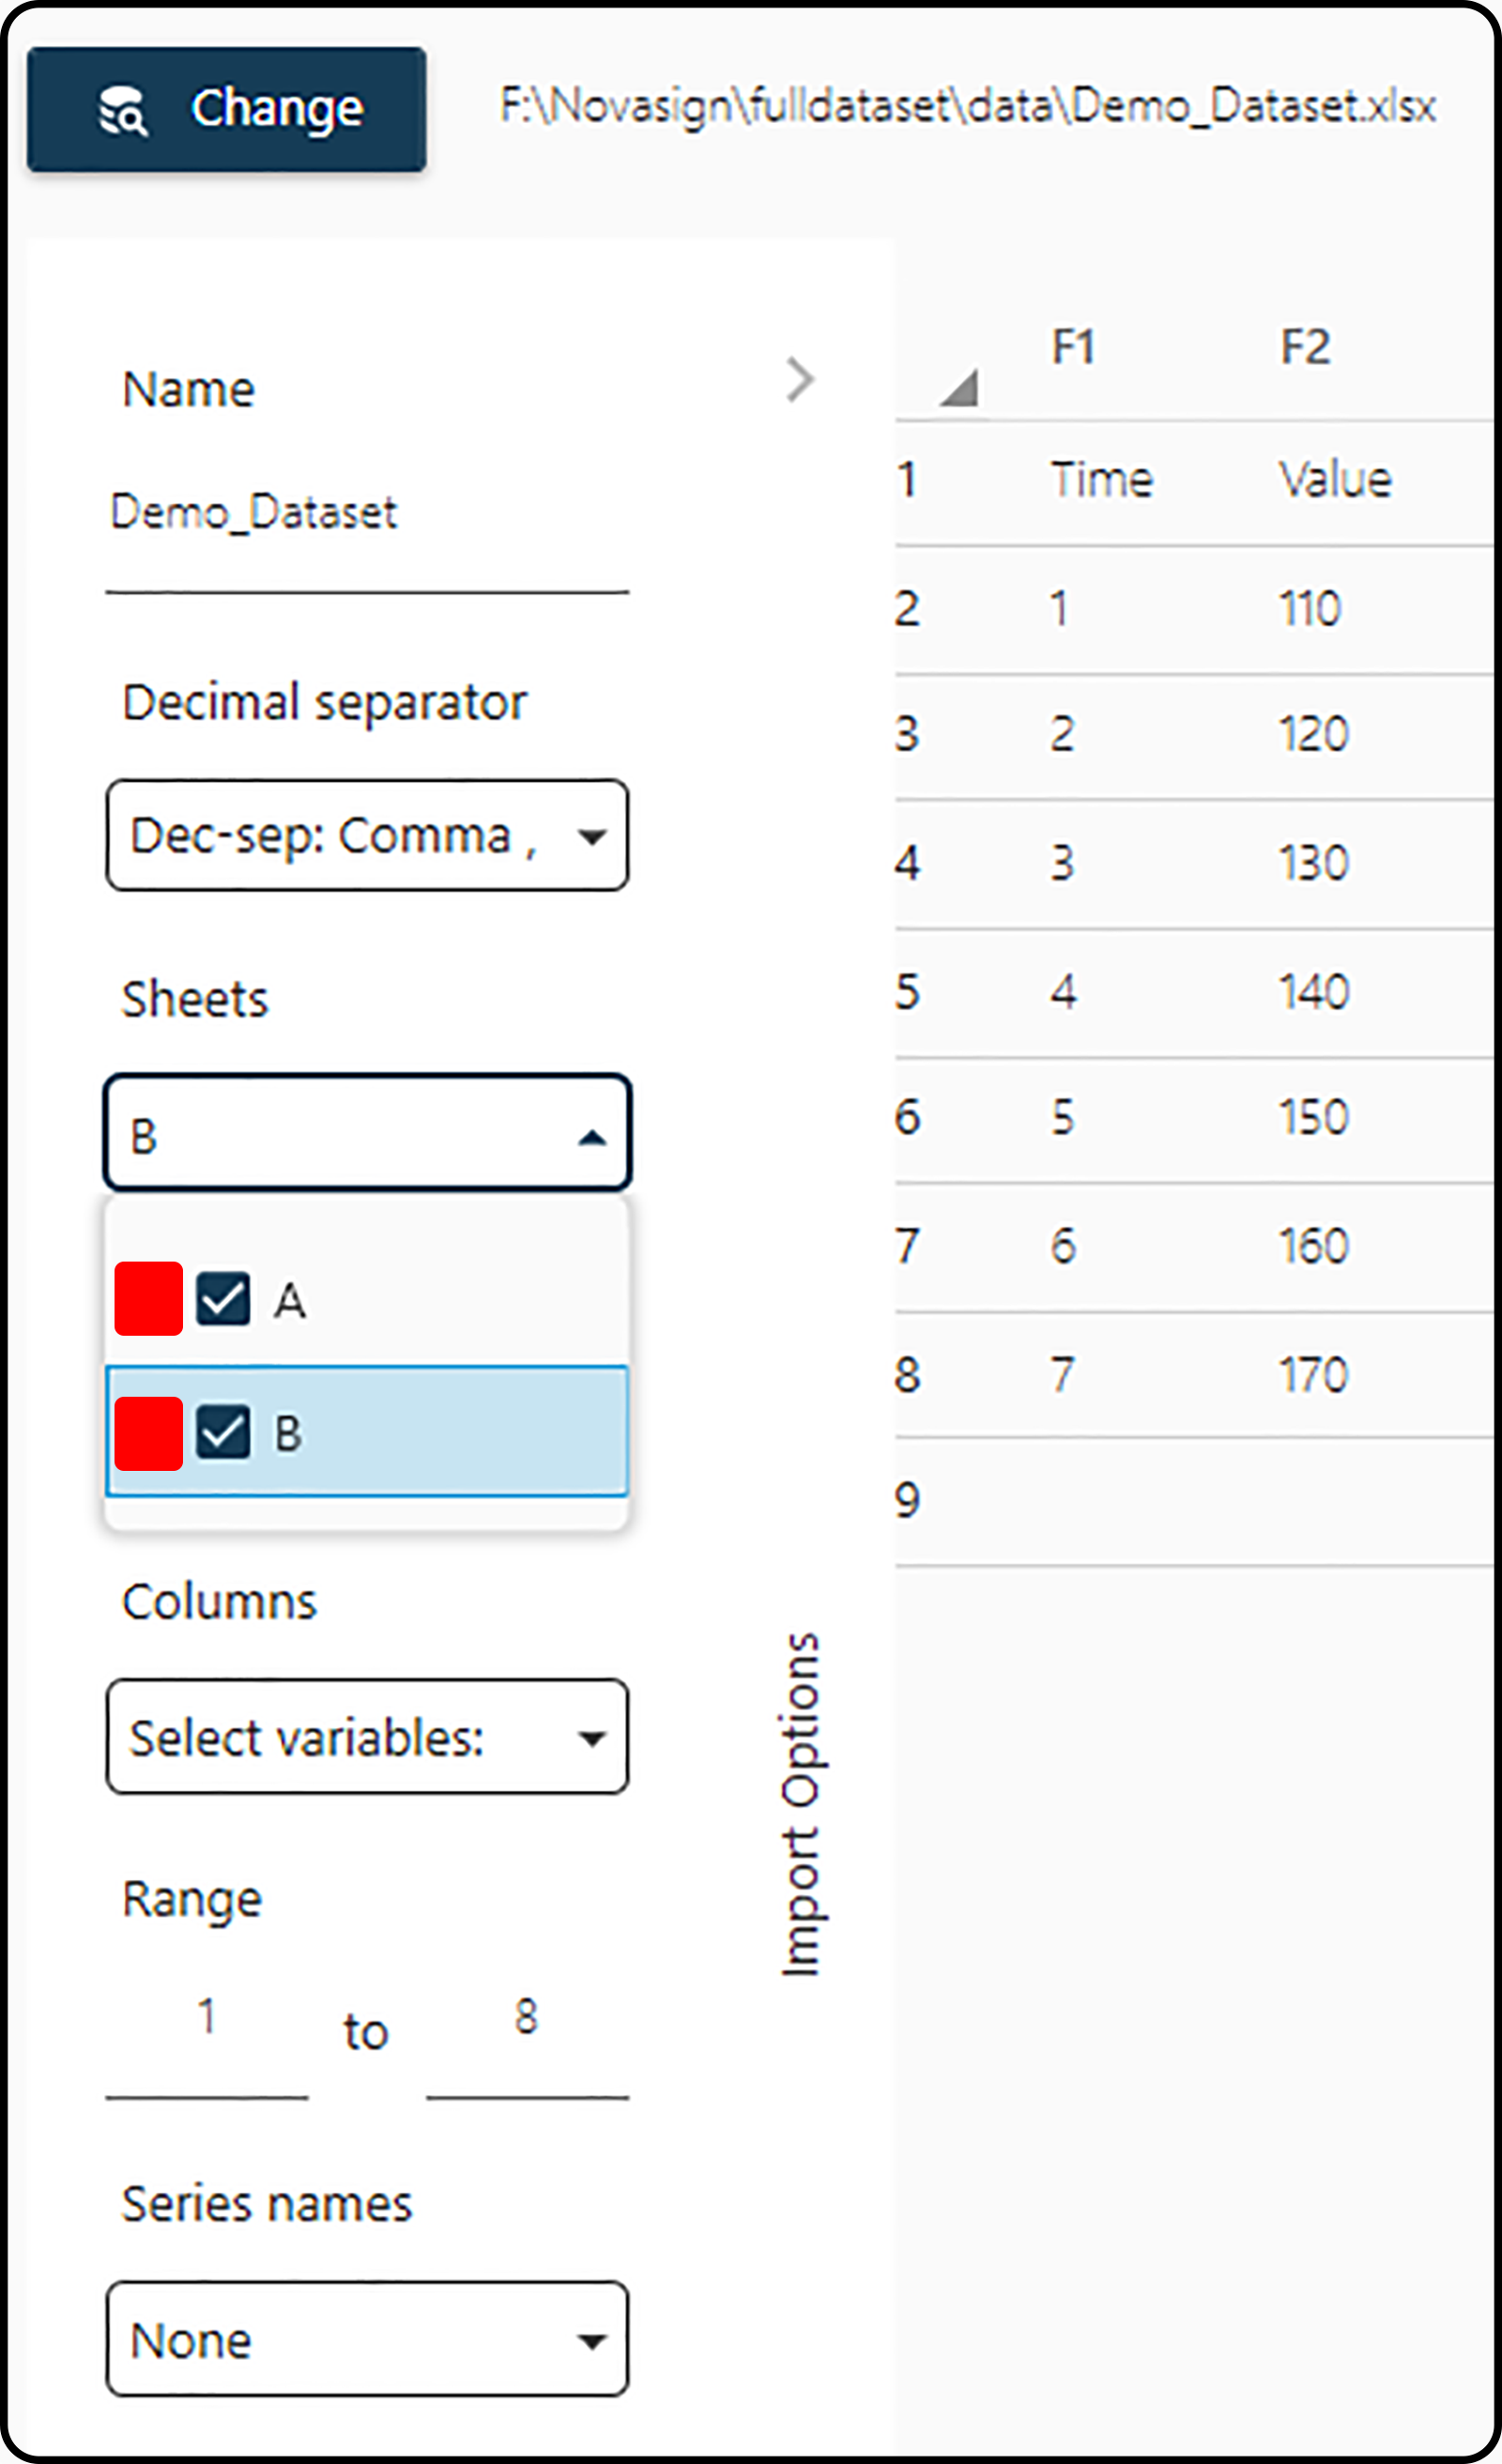
Figure 11. Selecting a sheet to display it in the data viewer by clicking in the red marked regions.
Series name
Important
This feature is intended for time series datasets, where each row in the data represents an observation at a certain point of time. It allows for the separation/identification of single runs or experiments. It is of high importance both for e.g. plotting the data, but also for modeling purposes.
The first entry in this column must be numeric (e.g. the experiment number or the run ID), all further values for this run/experiment should be missing/blank/empty (see the small artificial example below).
If no such column exists in your data, select
Nonein the import options.
Example
Suppose there is a data set with a Time column, a data column VAR_A and an Id column giving the number of the experiment.
Time |
VAR_A |
Id |
|---|---|---|
0 |
2 |
8 |
1 |
3.2 |
|
2 |
5 |
|
3 |
5.5 |
|
4 |
5.75 |
|
5 |
5.9 |
|
0 |
3 |
14 |
1 |
4.5 |
|
2 |
6.2 |
|
0 |
2.7 |
16 |
1 |
4.2 |
|
2 |
5.6 |
|
3 |
5.98 |
If the Series name in the import options
is set to
None, when plotting data, different time series legends will be automatically auto-incremented starting from value1.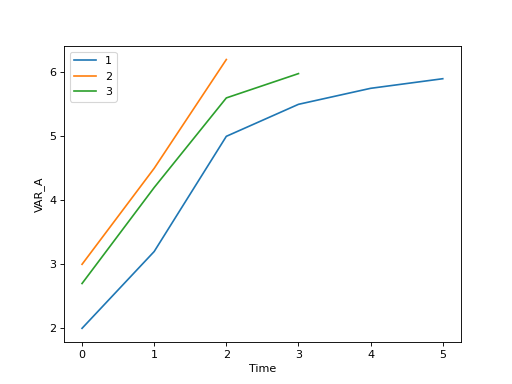
is set to the
Idcolumn, the legend will be more valuable for the user, as now the run ID is directly displayed.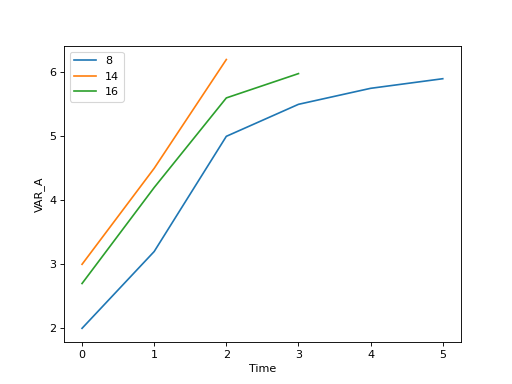
Data range
Selecting a row-wise subset of the data might be particularly useful in (at least) 3 situations:
Generally, to exclude certain observations/rows/experiments from import
If multiple header rows are present in the data – the data range should then start after the last header row such that the data do not contain any non-numeric values (which would result in an error).
If one or more rows towards the end of the source file contain empty cells only.