Creating a report
Once learning is completed, models can be inspected by generating a report with the Report button
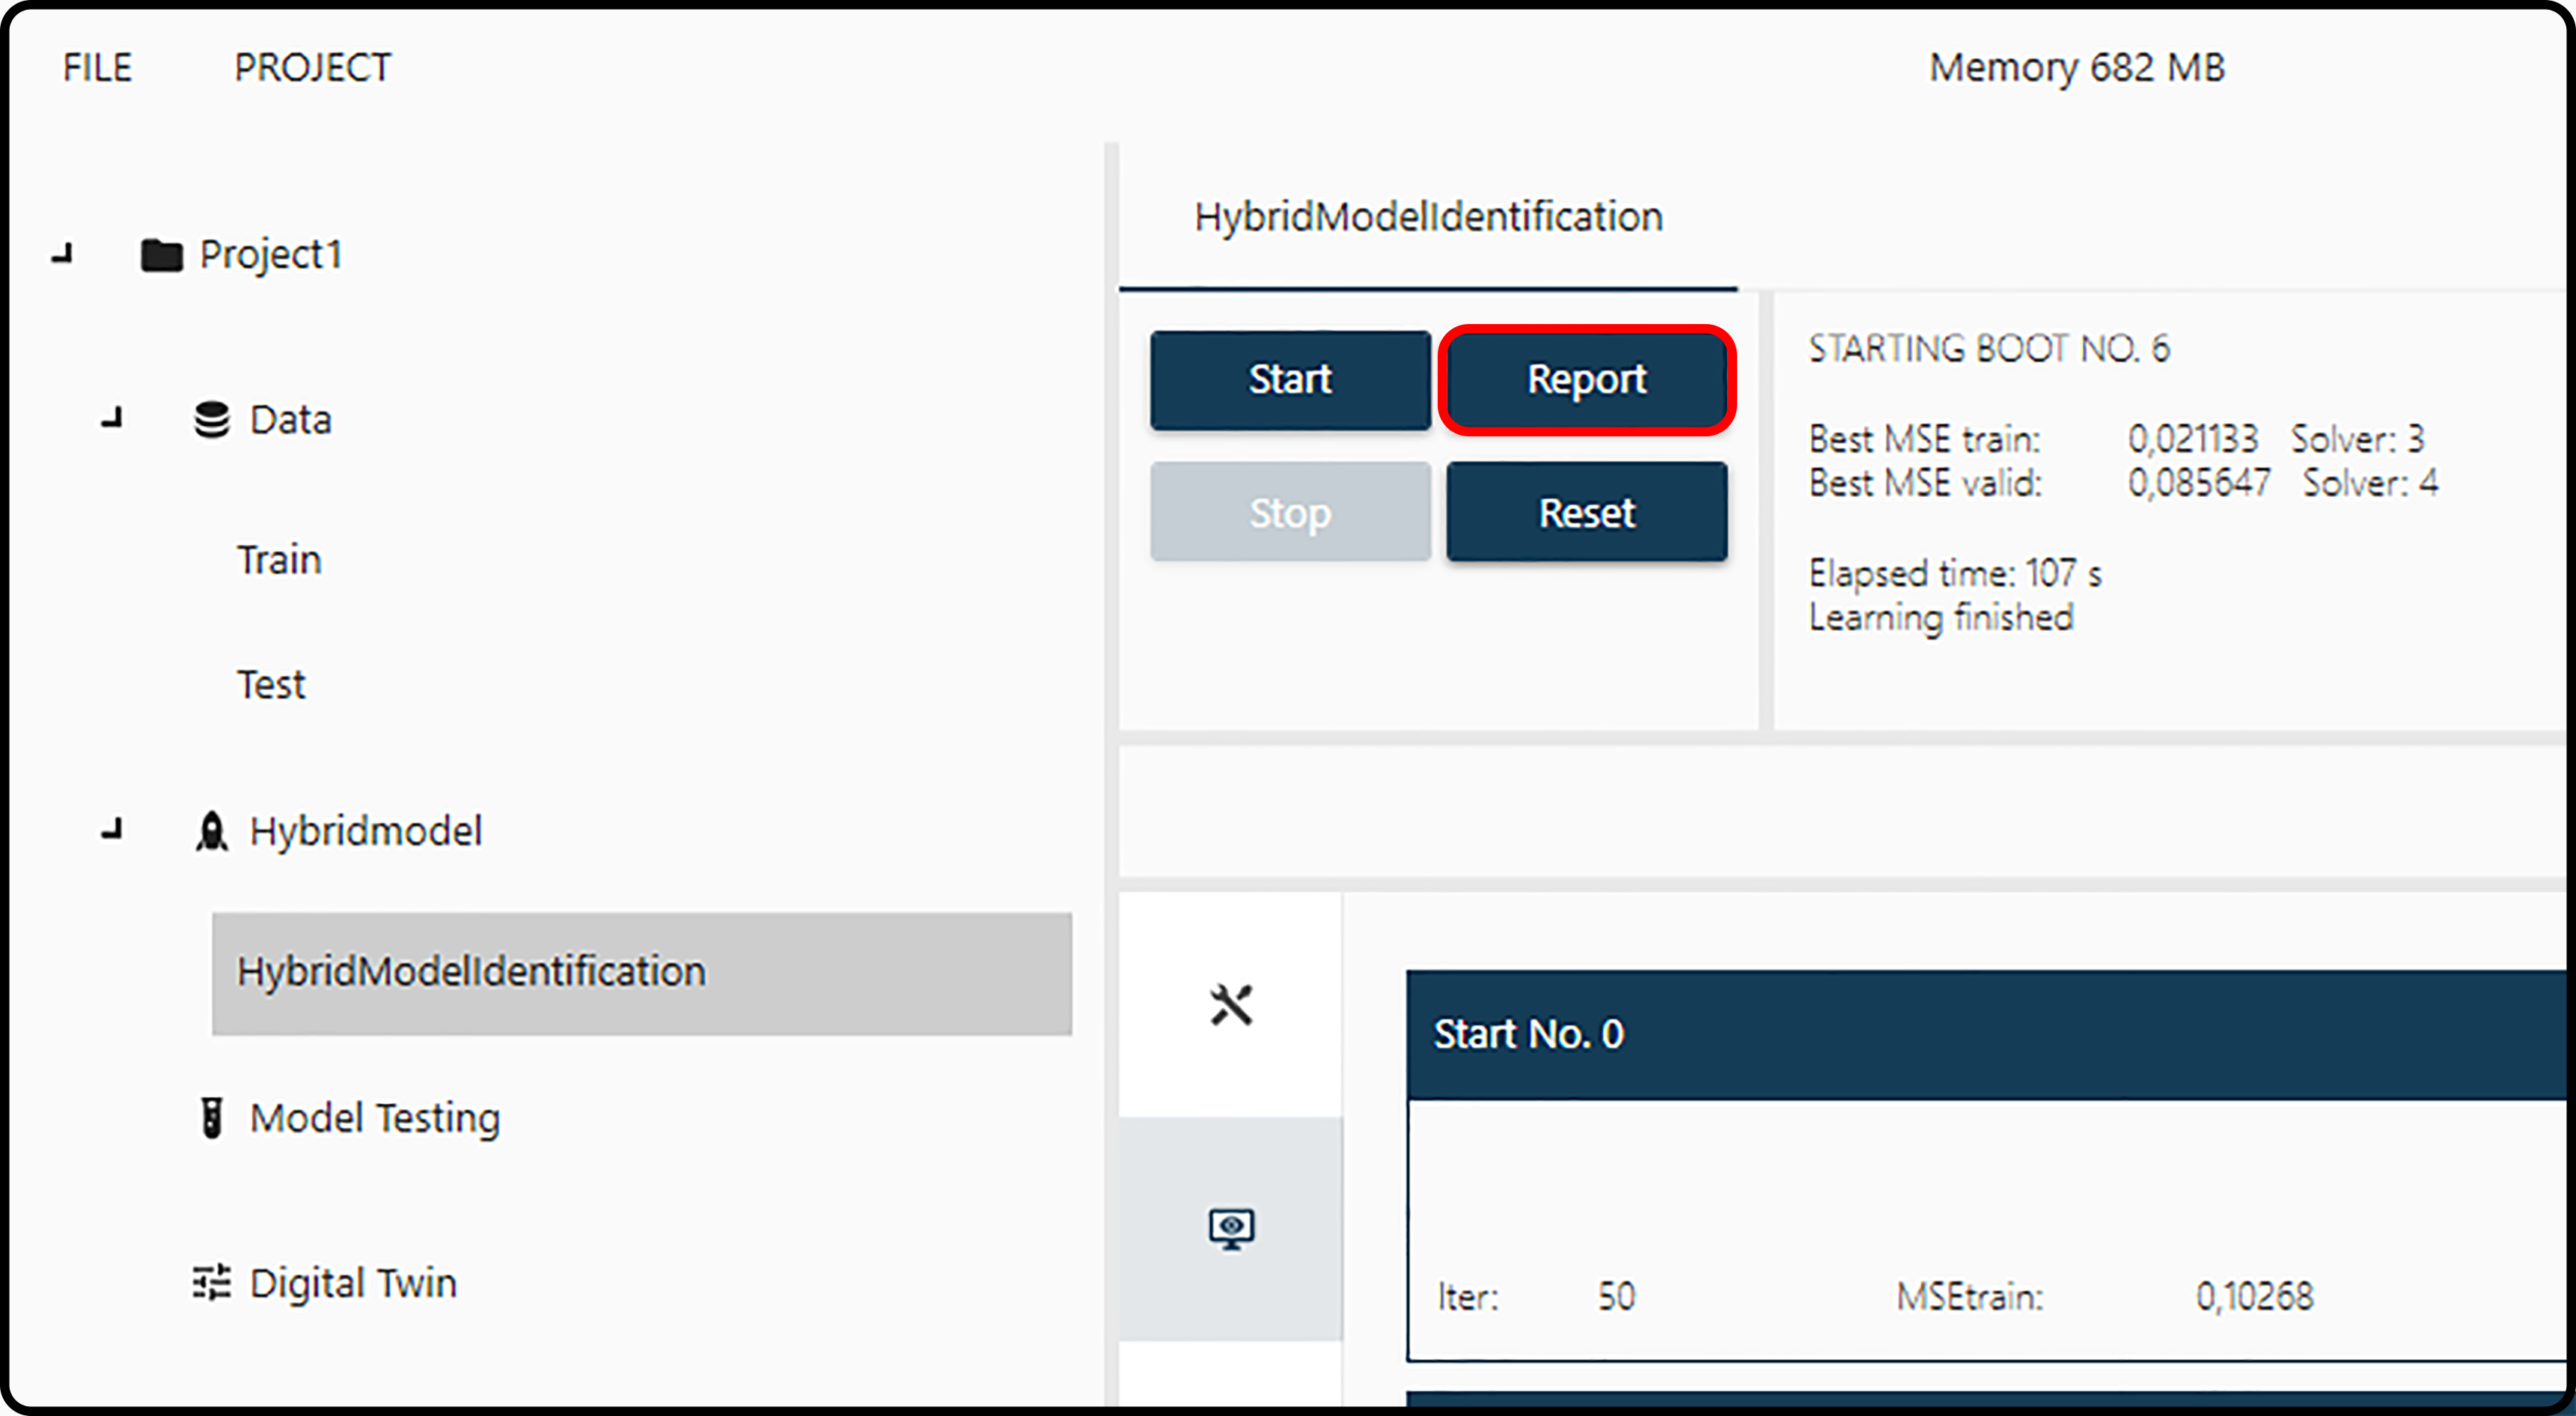
Figure 25. Creating a model report.
This will open a new window for selecting models. As many models as undisposed ones will be displayed.
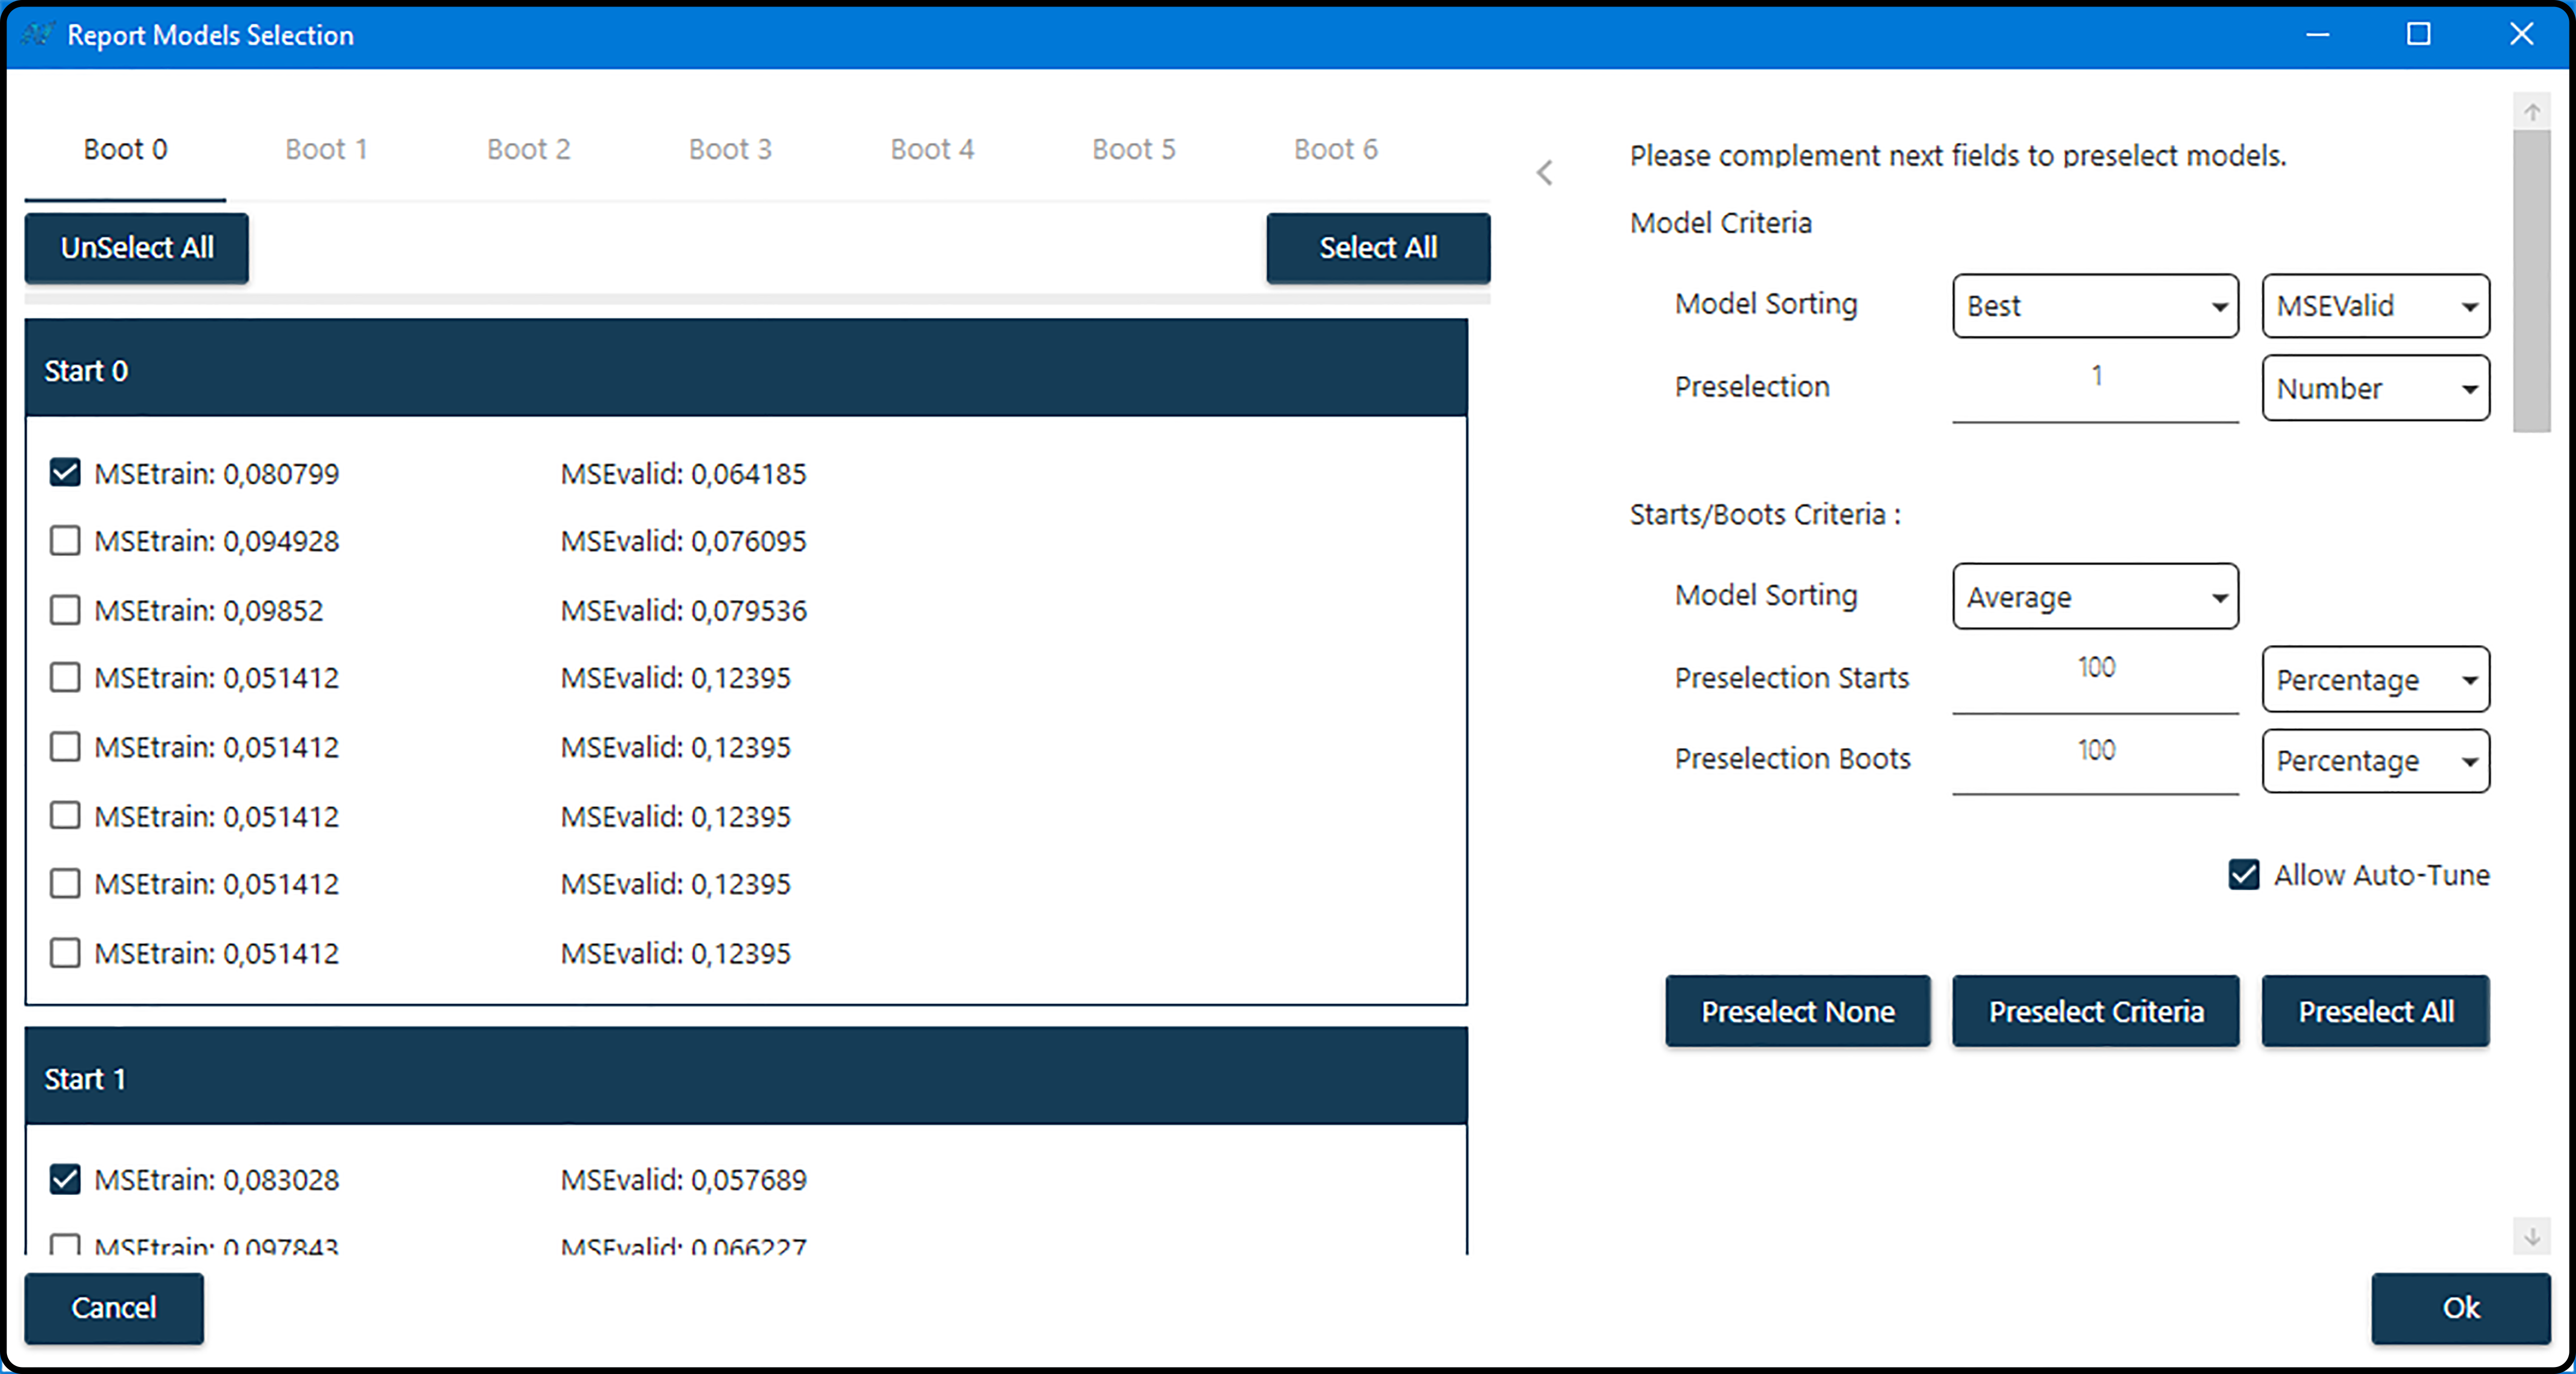
Figure 26. Selecting models according to different criteria.
Model selection
Following the identification structure, models are organized in boots and starts in the left part of the window. Each boot has a dedicated tab with as many sections as random starts were selected, containing all undisposed models. For each model, the training and validation mean-squared errors (MSE) are shown.
Note
If the learning process was stopped by user, some starts and/or boots might be orphan as models where never generated.
As many models as desired can be selected/unselected from each available boot and/or start manually by using the checkbox. For a faster selection and/or deselection, each boot has the options Select all and Unselect all. This action propagates only to the current selected boot.
Model preselection
Model preselection (eventually combined with a manual model selection in a second step) is a useful feature, particularly if a high number of boots and/or starts are available. Model preselection is applied by default, when the report model selection window is shown.
Preselection is performed by options displayed in the right part of the window
All/None
Independently of other Model preselection fields, when clicking Preselect none (or Preselect all), none (or all) available models (from all boots/starts) will be selected. This feature will be useful, if only a low number of models has been generated.
Criteria
Typically, models will be sorted first according to various (quality/performance) criteria and the best performing models selected by clicking on the Preselect criteria button.
Model Criteria: Models can be sorted according to their training or validation error (\(\text{MSE}_\text{Train}\) or \(\text{MSE}_\text{Valid}\)) or using an average of these two (\(\text{MSE}_\text{TrainValid}\)), either in descending or in ascending order by choosing Best or Worst. From each boot and each start the top \(x\) models (either given by a number or a percentage) can be kept.
Starts/Boots Criteria: After applying the previous model criteria, from each boot and each random start a certain number or percentage of models is now preselected. Now a selection among the boots and starts can be performed. Each boot/start combination can be characterized and sorted either by the average (Average) or maximum (Max) error of the remaining models. Now a certain number or percentage (to be specified in the Preselection Starts and Preselection Boots fields) of the top-ranked starts (comes first) and boots can be selected.
Note
Any selection based on model and/or starts/boots criteria must be confirmed by pressing the Preselect Criteria button, otherwise these choices have no effect.
Example Assume the following setup: models were built with
10 boots
6 random starts
20 iterations
option keep 8 best models
From the total \(10 \cdot 6 \cdot 20 = 1200\) models, only the best 8 are kept for each boot/start combination, which makes in total \(10 \cdot 6 \cdot 8 = 480\) models appearing in the model selection window. Sorting according to the best \(\text{MSE}_\text{Valid}\) (lowest validation error) and preselecting 25% of those, leaves 2 models for each start/boot combination (those with the lowest validation error), in total 120 models.
Selecting Average in the starts/boot criteria model sorting, calculates the average error of these 2 models for each starts/boot combination, resulting in \(10 \cdot 6 = 60\) average errors. Choosing 50% as starts preselection selects the best 3 (of the 6) starts from each boot. Finally, the remaining 60 models (10 boots, 3 random starts, 2 models per start) are averaged per boot and choosing e.g. 50% as boot preselection only keeps \(5 \cdot 3 \cdot 2 = 30\) models.
Important
It is recommended to leave the option Allow Auto-Tune checked. In case the user enters percentages don’t fully match with current boots/starts/models setup,
these will be automatically reassigned to a value that makes more sense.
For example, assume learning contains 15 boots and it is manually stopped before starting boot number 2. In this case if Allow Auto-Tune is checked,
Preselection Boots [%] will be set to 100% as only 1 boot was computed – irrespective of the user setting.
Once the model selection is completed, the report appears in the main bar. Clicking on it leads the user to the Reports section.
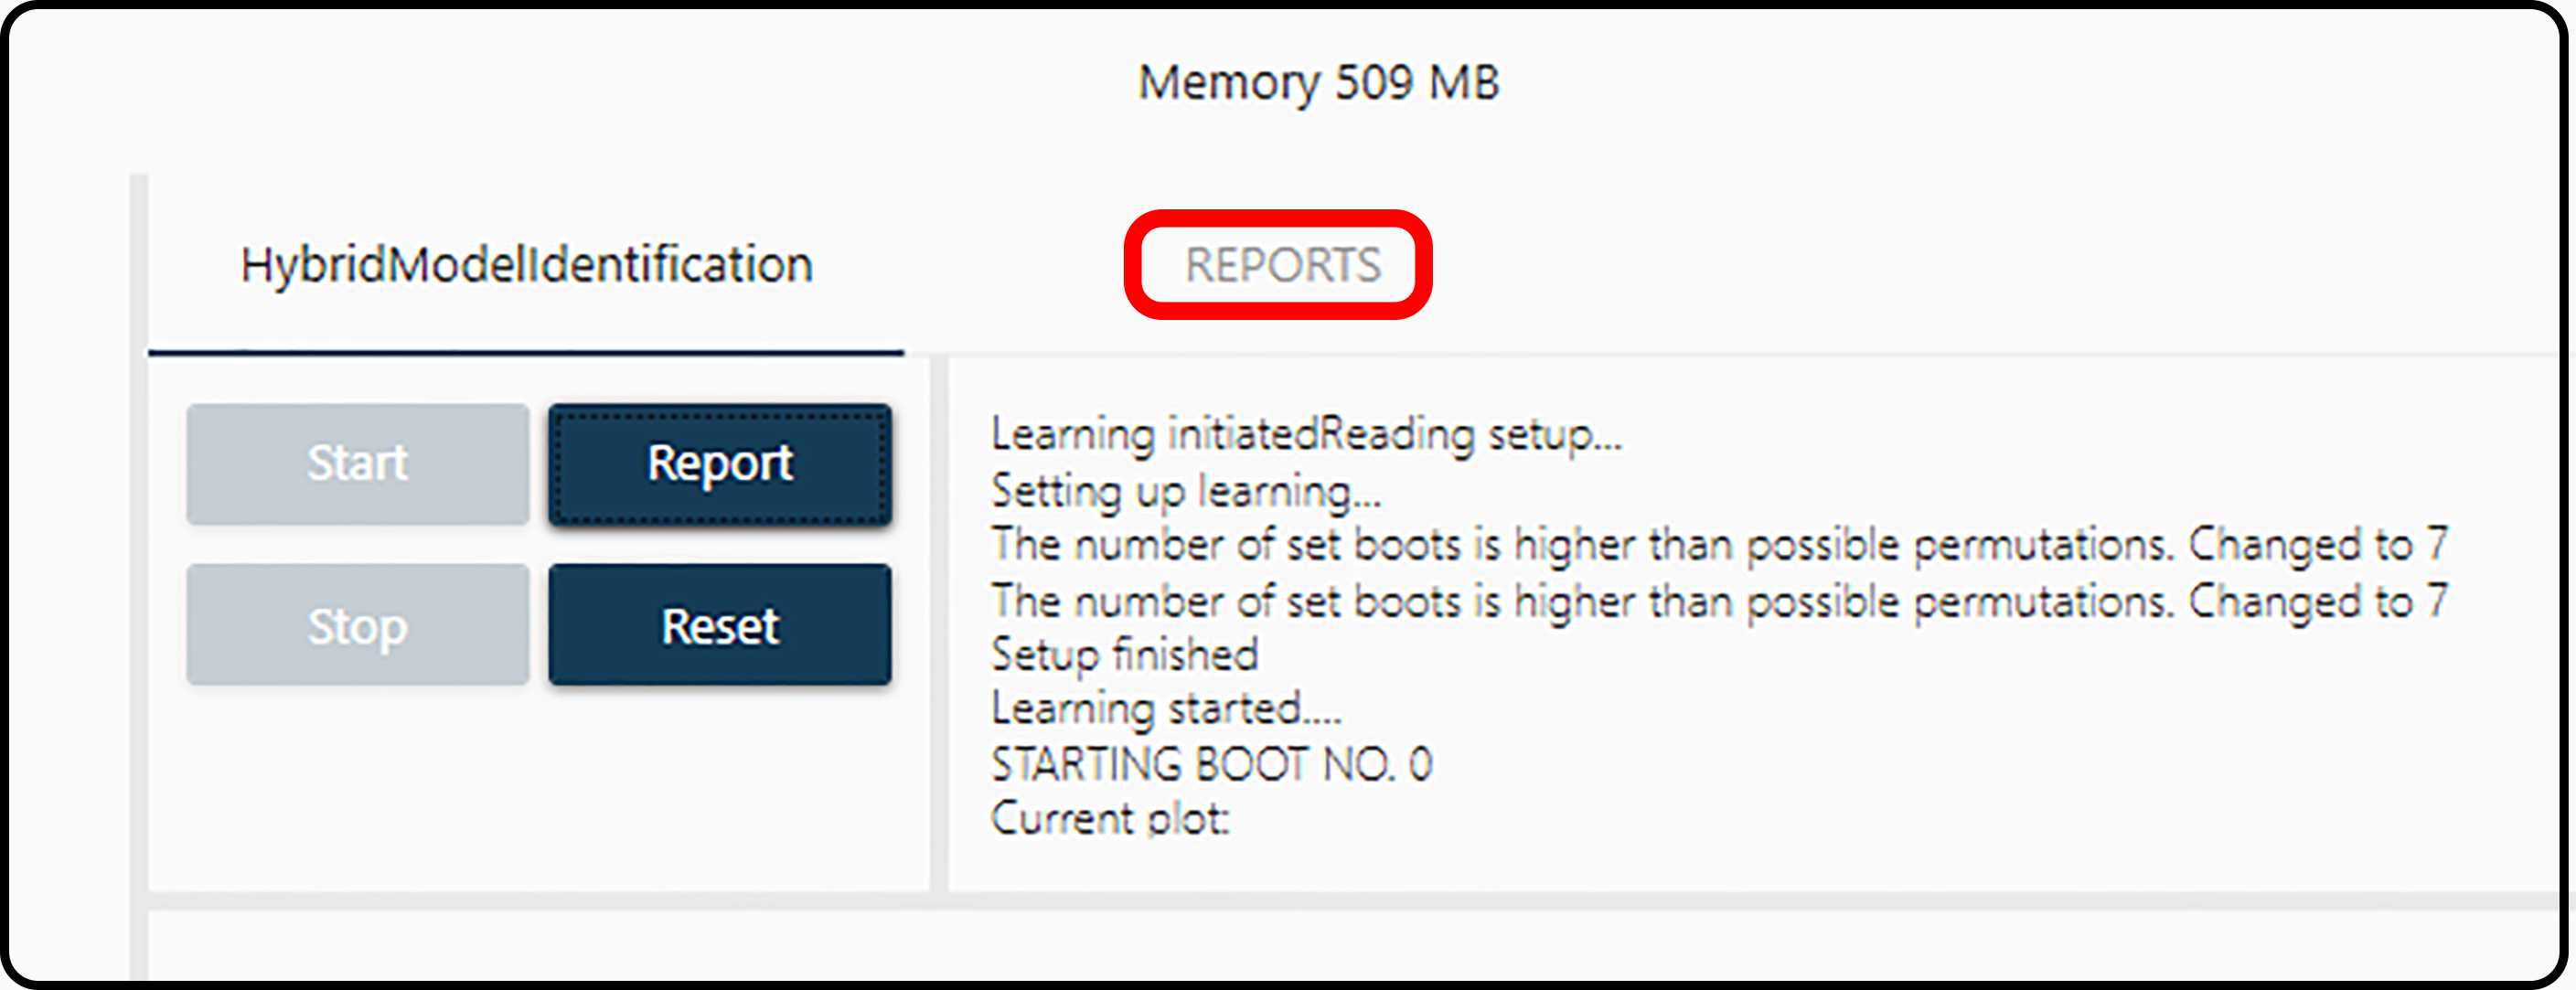
Figure 27. After model selection, the report appears in the top bar.
Switching between different reports is done via the drop-down menu – all reports will be numbered consecutively. The two main actions in the Report section are the generation of model quality reports (upper icon) and the visualization of the model performance via 2D plots (lower icon).
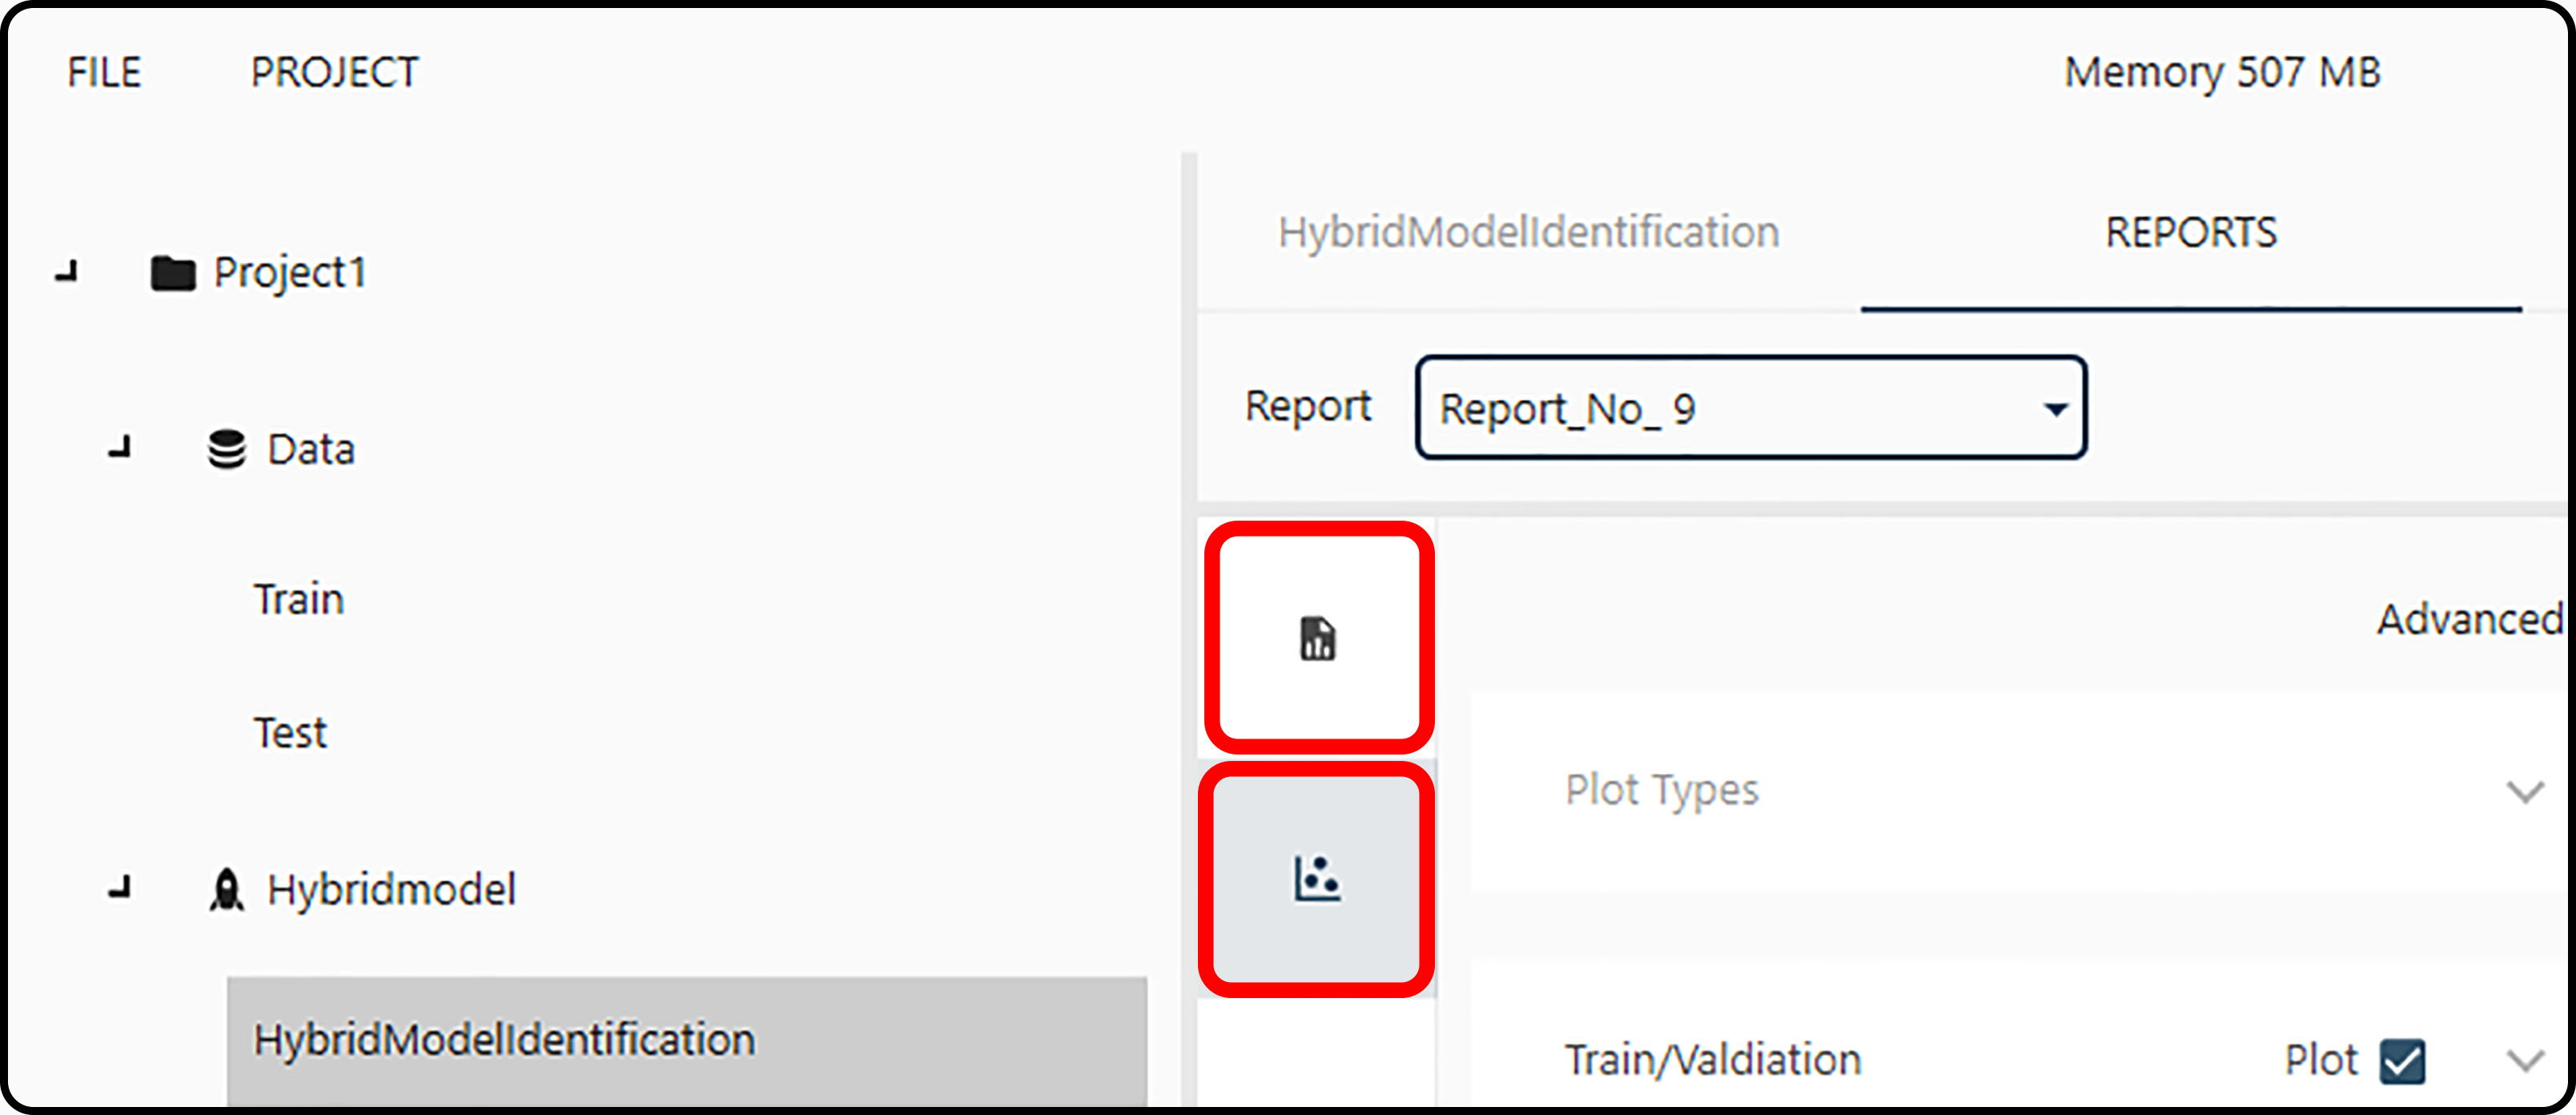
Figure 28. In the reports section either various quality parameters can be obtained in the quality report section or plots can be generated.